
Preparation:
- Reagents: DAPI (Sigma-Aldrich: 10236276001).
- Prepare a stock solution of DAPI by dissolving in de-ionized water to a final concentration of 1 to 5 mg/mL.
- NOTE: Do not use any buffers.
- Prepare a working solution of DAPI by diluting the stock solution with methanol to a final concentration of 1 μg/mL.
- Store stock solution (1 to 5 mg/mL) at -15–-25°C for up to 1 year.
- Store working solution (1 μg/mL) at 2–8°C wrapped in tinfoil for up to 6 months.
Procedure:
- Prepare samples for flow cytometry.
- After the final wash step, resuspend cells in PBS with 1–2% FBS and sodium azide containing 0.05–0.2 μg/mL DAPI.
- The optimal concentration of DAPI for cell viability analysis may vary by cell type. Please titrate the reagent for your cell type to ensure good resolution without oversaturation.
- NOTE: Do not add azide to the buffer if cells are being prepared for sorting.
- Incubate for 5 minutes at room temperature. DO NOT WASH.
- Acquire data on a flow cytometer.
Spectral Properties:
- DAPI can be excited at 355, 375 or 405 nm with an emissionmax at 460 nm (450/50 bandpass filter).
- DAPI cannot be used with fluorophores like Brilliant Violet 421, eFluor450, VioBlue Dye, V450 or Alexa Fluor® 405.
- Use of the violet laser for DAPI excitation leaves commonly used detectors for the blue and red lasers free with little expectations for compensation between colors (depending on fluors chosen).
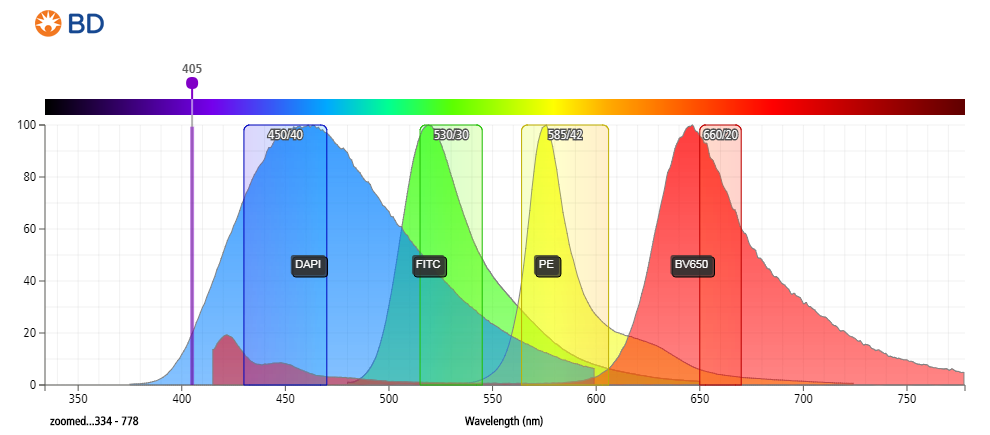
Figure 3: Emission spectrum of DAPI compared to other commonly used fluorophores.
Preparation:
- Reagents: 7-AAD (Sigma-Aldrich: A9400), PBS, Sodium Azide (Sigma-Aldrich: S8032), DMSO (Sigma-Aldrich: D5879).
- Prepare a stock solution of 7-AAD at 1 mg/mL by dissolving 1.0 mg 7-AAD powder into 50 µL of DMSO.
- Add 950 µL of PBS containing 0.01% Sodium Azide.
- Store at 2–8°C wrapped in tinfoil for 1 month.
Procedure:
- Add 1 µL of 7-AAD stock solution to approximately 106 cells ready for analysis.
- Incubate cells in the dark for 15 minutes at room temperature. DO NOT WASH.
- Acquire data on a flow cytometer.
Spectral Properties:
- Strong excitation at 488 nm (blue laser), stronger excitation at 561 nm (yellow-green laser).
- Detected between 600 and 750 nm (emits at ~647 nm).
- Compared to PI, 7-AAD offers the advantage of being compatible with 2-color analysis using phycoerythrin (PE) and fluorescein isothiocyanate (FITC) labeled monoclonal antibodies, with minimal overlap between the fluorescence emissions of 7-AAD, PE, and FITC.
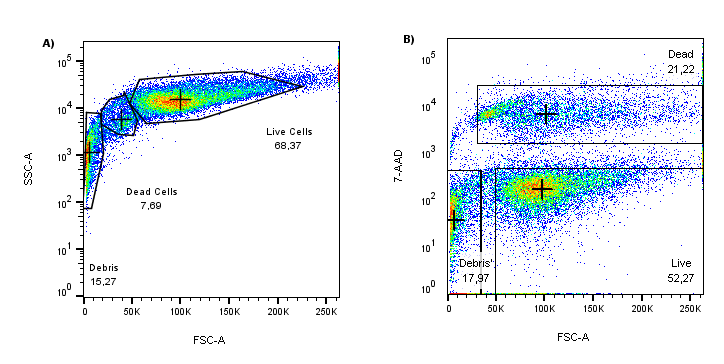
- Provides better resolution between live and dead cells.
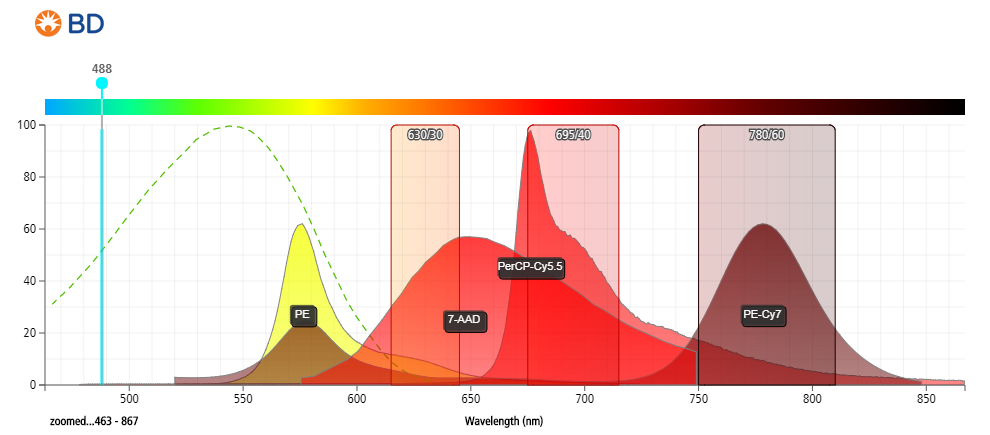
Figure 2: Fluorescent emission profiles of 7-aminoactinomycin D and other commonly used fluorophores when excited at 488 nm.
Preparation:
- Reagents: PI (Sigma-Aldrich: P4170), PBS, Sodium Azide (Sigma-Aldrich: S8032).
- Prepare a stock solution of PI at 1 mg/mL in PBS containing 0.01% Sodium Azide (undiluted stock is stable for up to 6 months at 4°C).
- Aliquot into 2–4 mL portions and store at 4°C wrapped in tinfoil.
Procedure:
- Dilute an aliquot of the PI stock solution to 100 µg/mL.
- Add PI to washed and stained cells ready for flow cytometric analysis.
- Add 1 µL of PI stock solution for each 100 µL of staining buffer in your samples.
- Incubate cells in the dark for 5 to 15 minutes at room temperature. DO NOT WASH.
- Acquire data on a flow cytometer.
Spectral Properties:
- Strong excitation at 488 nm (blue laser), stronger excitation at 561 nm (yellow-green laser).
- Detected anywhere from 550–700 nm.
- Significant overlap between PE and PE-tandems to 700 nm.
- Minimal compensation requirements required between FITC/GFP and PI if data acquired at longer wavelengths (~650–700 nm).
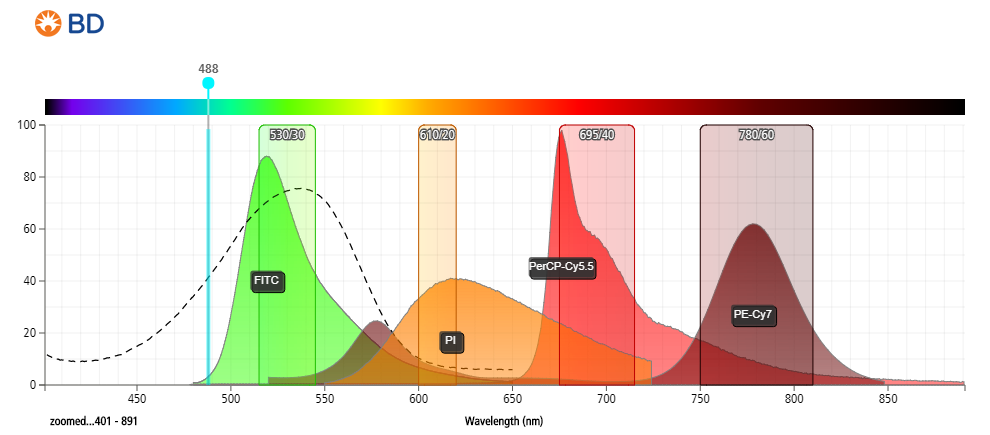
- Figure 1: Fluorescent emission profile of propidium iodide (PI) and spectral overlap with commonly used fluorophores when excited at 488 nm.
Amine reactive dyes are another type of molecule that can selectively label dead and live cells. Similar to classical DNA binding dyes, they rely on cell permeability to enter the cell. However, unlike DNA stains, these dyes react irreversibly with free amine groups of proteins both on the surface and inside cells. There are more free amine groups on the interior of cells, which means that dead cells stain much more brightly than healthy cells. These dyes can also withstand harsh cross-linking reactions, making them very useful for measuring viability at the time of fixation.
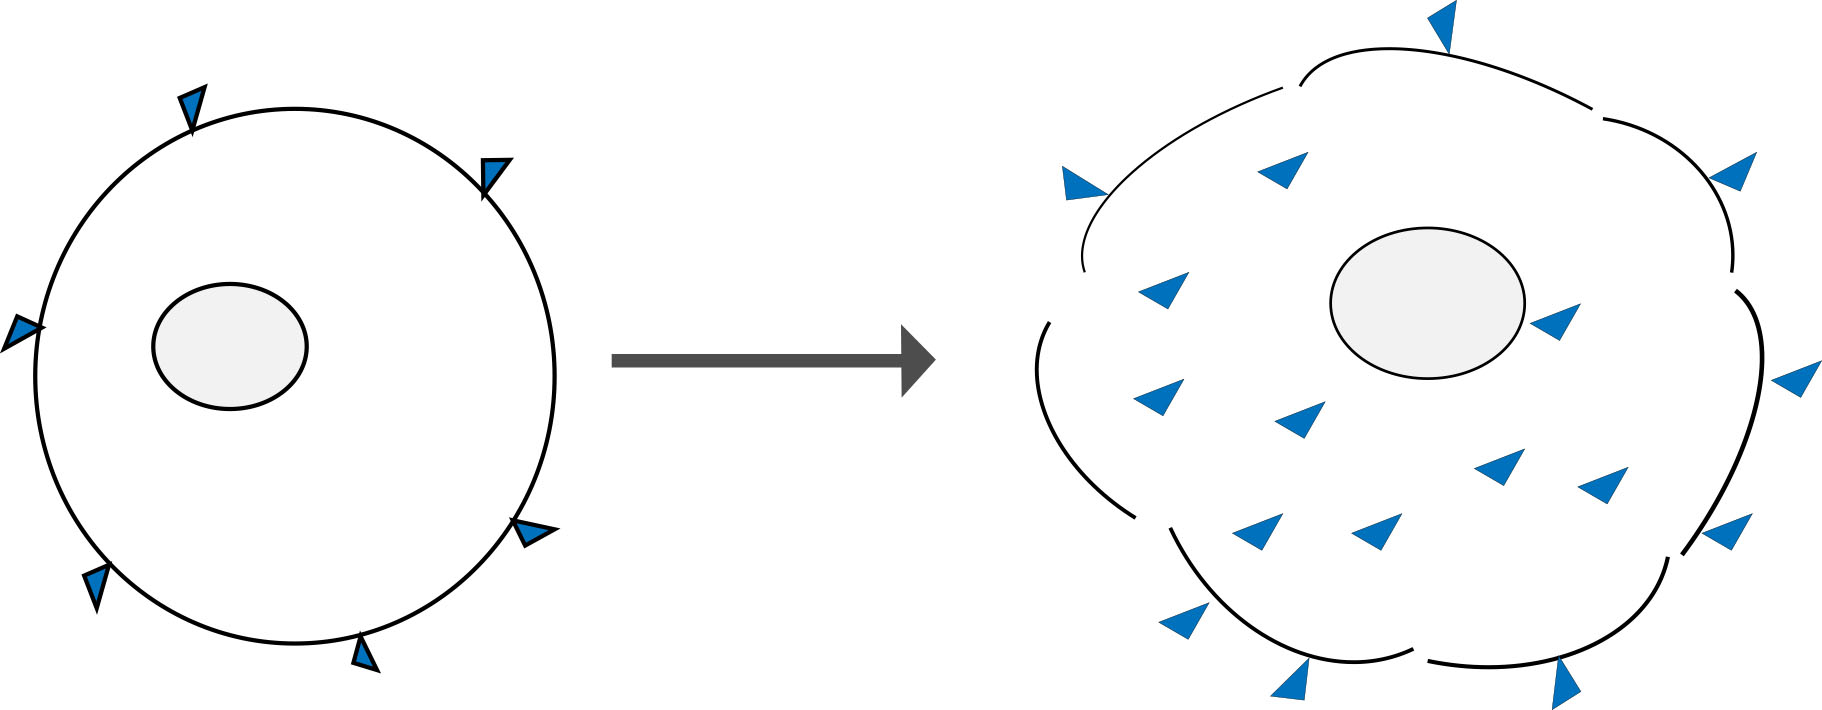
Figure 4: Amine reactive dyes bind only to the surface of live cells (left) and in lesser amounts when compared to cells that have lost membrane integrity (right). The porous membrane allows greater dye access to the free amines group of intracellular proteins which yields a brighter fluorescent signal when viewed on a flow cytometer.
These dyes have become more popular since first coming onto the market in 2010 and are available in an array of colors allowing for easy incorporation into any staining panel.
Ethidium monoazide bromide is a fluorescent nucleic acid stain that covalently binds to DNA after photolysis when exposed to UV light. Because this probe is relatively impermeable to live cells, it selectively labels DNA in dead versus live cells, making it useful in complex staining protocols involving fixation and further staining. This method is less widely used due to the popularity of amine reactive dyes, but it remains a cost-effective alternative for dead cell staining. It offers additional emission options not available with amine reactive dyes, such as PE-Texas red wavelengths.
Preparation:
- Reagents: EMA powder (Thermo Fisher Scientific Inc.: E1374) or (Sigma-Aldrich: E2028).
- Prepare a stock solution of EMA at 5 mg/mL in DMSO and store as single use aliquots in a desiccator at -20°C under foil or in light resistant tubes.
- Depending on the optimal working concentration for your current lot, add enough EMA (dilute accordingly) to achieve a final concentration of 0.5–5 μg/mL.
- Titration will be necessary. NOTE: Too much EMA can lead to extremely high background fluorescence leading to an underestimation of live cells.
- If using EMA at 0.5 μg/mL, add 10 μL of stock solution to 990 μl of FACS staining buffer.
- Add 1 μL of working solution/100 μL of final staining volume/sample (stain cells in ~100–200 μL)
- Incubate cells under a bright fluorescent lamp at a distance of approximately 18 cm for 10–15 minutes. DO WASH cells twice with PBS.
- Stain with extracellular fluors and then fix as desired.
- Acquire data on a flow cytometer.
Spectral Properties:
- EMA is extremely light sensitive, so care must be taken to minimize exposure to light when making the stock solution, storage, and up until addition to samples.
- EMA can be excited with 488 nm or 561 nm laser light (excitationmax = 510 nm) with detection in the PECy5 (670 nm) or PE-Texas (610 nm) red channels (emissionmax = 600 nm).
- Include an EMA compensation control when using in multicolor flow cytometry applications
- EMA emits across a wide range of wavelengths (see spectrum below) and can potentially have large spillover values with fluors like PE-Cy5.
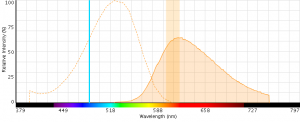
Figure 5: EMA excitation at 488 nm with an emission bandpass filter typical for PE-Texas Red centered at 610 nm.
Kuonen, F., Laurent, J., Secondini, C., Lorusso, G., Stehle, J.C., Rausch, T., Faes-Van’t Hull, E., Blouin, J.L., & Alghisi, G.C. (2010). Fc block treatment, dead cells exclusion, and cell aggregates discrimination concur to prevent phenotypical artifacts in the analysis of subpopulations of tumor-infiltrating CD11b+ myelomonocytic cells. Cytometry, 77A, 1082–1090. https://doi.org/10.1002/cyto.a.20969
Perfetto, S.P., Chattopadhyay, P.K., & Roederer, M. (2006). Amine reactive dyes: An effective tool to discriminate live and dead cells in polychromatic flow cytometry. Journal of Immunological Methods, 313(1-2), 199–208. https://doi.org/10.1016/j.jim.2006.04.007
Schmid, I., Krall, W.J., Uittenbogaart, C.H., Braun, J., & Giorgi, J.V. (2001). Simultaneous flow cytometric measurement of viability and lymphocyte subset proliferation. Journal of Immunological Methods, 247(1-2), 175–186. https://doi.org/10.1016/S0022-1759(00)00323-9
BD Biosciences: BD Horizon Fixable Viability (FVS) Reagents
BioLegend: All New Zombie Dyes (Blog Post)
BioLegend: Live Cell/Dead Cell Discrimination
BitesizeBio: Viability Dyes for Flow Cytometry: It’s Not Just a Matter of Life and Death
Expert Cytometry: 3 Reagents for Identifying Live, Dead, And Apoptotic Cells by Flow Cytometry
R&D Systems: Flow Cytometry Protocol for Analysis of Cell Viability using Propidium Iodide
Thermo Fisher Scientific Inc.: Checking Vital Signs: Don’t Let Dead Cells Mislead You
Thermo Fisher Scientific Inc.: Ethidium Monoazide Bromide
Thermo Fisher Scientific Inc.: Fixable Viability Dyes for Flow Cytometry