Intro To Flow
A flow cytometer consists of fluidics pumps, lasers, fluorescence detectors, signal converters, and computers which are used to analyze physical characteristics of particles or cells in suspension and sort them from mixed populations.

A flow cytometer consists of fluidics pumps, lasers, fluorescence detectors, signal converters, and computers which are used to analyze physical characteristics of particles or cells in suspension and sort them from mixed populations.
When samples are placed on a flow cytometer, particles are taken up into a stream that carries them into a transparent quartz chamber (flow cell) where they are illuminated by a series of lasers. As each cell moves into the flow cell, their relative cell size and complexity are measured based on their light scattering properties. Specifically, light scattered in the forward direction around the cells directly relates to cell size, whereas light scattered over the cell surface and interior membranes relates to granularity. These two measurements, when correlated, provide the preliminary basis for selecting a population of cells from a mixed sample, but are used mainly as identifiers of general cellular categories. Fluorescence measurements are subsequently used to determine a wide range of other cellular properties.

Figure 1: Left – A cell crossing a 488 nm laser causing light scattering in the forward and side directions. Right – A 2-parameter dot plot of peripheral blood mononuclear cells showing their light scattering patterns in forward (x-axis) VS side (y-axis) scatter axes. The cells can be divided into three subclasses based on scattering alone: A) lymphocytes (low fsc/ssc), B) monocytes (mid high fsc/ low ssc), and C) granulocytes (high fsc and high ssc).
Investigators are often interested in looking for the presence and/or absence of proteins on the cell surface, whether the cells are dying, if they remain healthy after drug treatments, and whether or not these treatments affect cell division, etc. To achieve this, cells can be labelled with antibodies conjugated (tagged) to various light emitting molecules, fluorophores, or directly stained with dyes that emit fluorescence when exposed to specific wavelengths of light. The binding of these probes is revealed once their fluorophores are excited as the cells travel past the lasers and emit light photons in the visible spectrum. These photons are then detected by photomultiplier tubes (PMTs) set up to collect emissions in distinct color ranges. i.e. greens, yellows, and reds, etc.

Figure 2: As a cell moves through the flow cell it may encounter one or more lasers. Fluorophores, excited by their corresponding lasers, are excited and fluoresce in the visible range. Fluorescent photons are collected through a series of pinholes at the back of the flow cell and split into color bands based on wavelength before reaching the detectors. Once the cell has completed its journey though the flow cell, data for each laser is combined for the entire cell.
Instruments with multiple excitations and the availability of fluorophores spanning the entire visible light spectrum allow scientists to study several variables at once. These assays can be as simple as looking at the modulation of one to two molecules in relation to each other or extremely complex where up to 30 fluorescent parameters are studied on a single cell (even 48 parameters if your samples are different subsets of cellular complexity). The data is collected and processed at speeds approaching tens of thousands of events per second and can yield large, complex data sets requiring lengthy and highly detailed analyses. Although this task can be at times daunting, the data collected provides much insight into the function of cellular models of disease, which can then be applied translationally toward human systems.
For example, flow cytometry is commonly used in a clinical setting to assess disease in cases like leukemias or HIV. When a patient has HIV, common cellular markers on their T-cells change and can be used to assess disease progression. Specifically, infection leads to the loss of CD4 positive T-helper cells over time, in turn leading to the collapse of the immune system and the development of AIDS whereupon opportunistic infections or other diseases, normally held in check by the immune system, run rampant. Monitoring of CD4 T-cell populations in infected individuals is commonly used to asses HIV progression and is easily measured by flow cytometry.
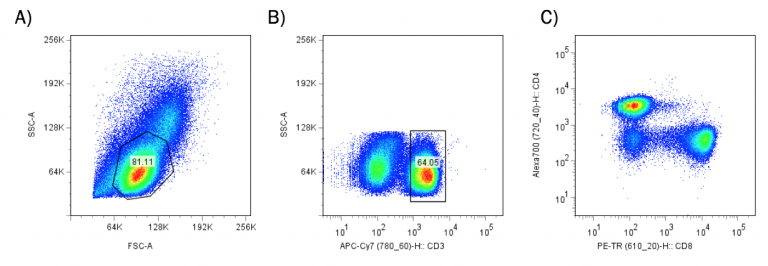
Figure 3: Human peripheral blood mononuclear cells have been labelled with T-cell specific antibodies: A) a plot of forward VS side scatter with a gate drawn around lymphocytes, B) CD3 APC-Cy7 fluorescence of cells within the lymphocyte gate VS side scatter, and C) CD8 PE-Texas Red VS CD 4 Alexa-700 profile of cells within the CD3 positive gate in figure B. A loss in the cloud of cells in the upper left portion of this plot could indicate a change in HIV status for an infected patient.
Flow cytometry is very robust as a clinical diagnostic tool in other areas such as lymphomas and other blood borne diseases, however its use in basic research is much more varied and not limited to extracellular measurements. The methodology has become a staple in many research fields as it yields large amounts of data in short periods of time.
For more information please visit our Applications page.
You may also want to review the very good tutorials on the Thermo Fisher Website regarding this topic.

Meet the friendly and diverse team that keeps the University of Toronto Flow Cytometry Facility running on a day-to-day basis.

Room 7226, Medical Sciences Building, 1 King’s College Circle, Toronto ON, M5S 1A8
Phone:416-978-6524
Copyright ©2025 Temerty Faculty of Medicine Flow Cytometry Facility. All rights reserved.