
2-Dimensional cell cycle analysis combines an additional parameter, such as proliferation, with a stoichiometric DNA-binding dye to more accurately identify cells in different cell cycle stages (Darzynkiewicz and Zhao, 2014). For example, DAPI staining can be combined with fluorescently-labeled EdU or BrdU. In this assay, cells in S and G2 phases will not only have increased DAPI intensity relative to G1 cells, but also fluorescence corresponding to EdU/BrdU S-phase incorporation (see Figure 1).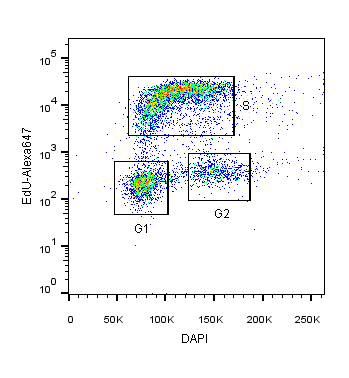
Figure 1: HEK293T cells co-stained with DAPI and EdU-Alexa 647 DNA binding dyes for the specific identification of cells in S-phase versus G1 or G2/M cell cycle phases.
Staining for markers associated with proliferation such as Ki67, phosphohistone H3, proliferating cell nuclear antigen (PCNA), topoisomerase II, and cyclin expression can be combined with a stoichiometric DNA-binding dye to increase the accuracy and resolution of cell cycle analysis.
Dyes used for DNA content analysis differ in their staining properties. Therefore, specific protocols and certain advantages/disadvantages accompany the use of each specific dye. Cell fixation and permeabilization are required for cell cycle analysis with propidium iodide (PI), 7-Aminoactinomycin D (7-AAD), 4′,6-diamidino-2-phenylindole (DAPI), and they can be achieved through various methods. Additionally, some dyes, such as PI, are not DNA-specific and will stain other double-stranded nucleic acids like RNA. When using PI, incubation of cells with RNase is necessary. In contrast, dyes like DAPI are DNA-specific and obviate this problem (Darzynkiewicz, Halicka, & Zhao, 2010).
Another important consideration when staining cells for this type of analysis is that cell concentrations must be consistent from sample to sample. This step ensures consistent saturation of DNA with the DNA-binding dye. Otherwise, issues such as peak spreading and changes in G1 peak median fluorescence intensity from sample to sample may arise, making experimental comparisons challenging. It is also important to note that the analysis of isolated nuclei may produce more accurate cell cycle characterization as opposed to the analysis of whole cells due to confounding mitochondrial DNA replication in actively proliferating cells (Darzynkiewicz, Halicka, & Zhao, 2010).
Dyes such as Hoechst33342, DRAQ5™, and Vybrant® DyeCycle enable DNA content analysis within live samples, allowing cells to be sorted by FACS for downstream assays on populations in specific cell cycle stages (Darzynkiewicz, 2011). Since these dyes are all membrane-permeant, no fixation or permeabilization step is required.
An important consideration when analyzing live stem cell populations is that drug efflux due to high expression of P-glycoprotein and other multi-drug resistance pumps can occur, preventing DNA saturation and the identification of a clear cell cycle profile. On the other hand, the dye efflux property of stem cells has been shown to be quite useful for identifying stem cells within a heterogeneous cell population through side population analysis.
The Fluorescence Ubiquitin Cell Cycle Indicator (FUCCI) system is used to track the cell cycle, and it relies on the cell-cycle dependent oscillating expression of two proteins, Geminin and Cdt1 (Sakaue-Sawano et al., 2008). The expression of these proteins is regulated via cell cycle-dependent ubiquitin-mediated proteolysis. Cdt1 expression is high during G1, whereas Geminin expression is high during the S, G2, and M phases. Thus, the expression intensity of these proteins can be detected to determine the cell cycle profile of cell populations. When non-functional variants of these proteins were linked to different fluorescent indicator proteins and expressed in HeLa cells, the detection of fluorescent signals, either from the presence of Ctd1 or Geminin, was correspondingly indicative of cell cycle stage (Sakaue-Sawano et al., 2008).
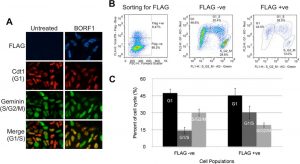 Figure 2: Screening cell cycle progression using Fucci cells. (A) Fucci cells were transfected with pMZS3F-BORF1 or left untreated and then stained for the FLAG tag on BORF1 and imaged for mKO2 (G1 cells; red), mAG (S/G2/M cells; green), and FLAG (blue). An overlay of red and green image layers revealed cells in G1/S, which display a yellow to orange color (bottom). (B) Fucci cells transfected with pMZS3F-BORF1 and stained for the FLAG tag on BORF1 were FACS sorted into FLAG-positive and FLAG-negative cells (left) and then further separated based on the expression of mKO2-Cdt1 and AG-geminin (middle and right). (C) Cell cycle stages determined from FACS analysis (as for panel B) were quantified for FLAG-positive (BORF1) and FLAG-negative cells from three independent experiments (Paladino et al., 2014).
Darzynkiewicz, Z., Halicka, D., & Zhao, H. (2010). Analysis of cellular DNA content by flow and laser scanning cytometry. Advances in Experimental Medicine and Biology, 676, 137–147. https://doi.org/10.1007/978-1-4419-6199-0_9
Darzynkiewicz, Z. (2011). Critical aspects in analysis of cellular DNA content. Current Protocols in Cytometry, Apr, Unit 7.2. https://doi.org/10.1002/0471142956.cy0702s56
Darzynkiewicz, Z., & Zhao, H. (2014). Cell Cycle Analysis by Flow Cytometry. In eLS. John Wiley & Sons, Ltd: Chichester. https://doi.org/10.1002/9780470015902.a0002571.pub2
Darzynkiewicz, Z., Robinson, J.P. & Crissman, H.A. (Eds.). (1994). Flow Cytometry. Methods in Cell Biology, 41 & 42. Academic Press, Inc.
Hedley, D.W., Friedlander, M.I., Taylor, I.W., Rugg, C.A., & Musgrove, E.A. (1983). Method for analysis of cellular DNA content of paraffin-embedded pathological material using flow cytometry. Journal of Histochemistry & Cytochemistry, 31(11), 1333–1335. https://doi.org/10.1177/31.11.6619538
Leers, M. P., Schutte, B., Theunissen, P. H., Ramaekers, F. C., & Nap, M. (1999). Heat pretreatment increases resolution in DNA flow cytometry of paraffin-embedded tumor tissue. Cytometry, 35(3), 260–266. https://doi.org/10.1002/(SICI)1097-0320(19990301)35:3<260::AID-CYTO9>3.0.CO;2-O
Paladino, P., Marcon, E., Greenblatt, J., & Frappier, L. (2014). Identification of herpesvirus proteins that contribute to G1/S arrest. J Virol, 88(8), 4480–92. https://doi.org/10.1128/JVI.00059-14
Rabinovitch, P. S. (1994). In Darzynkiewicz, Z., Robinson, J. P., & Crissman, H. A. (Eds.), Flow Cytometry (pp. 264–296). Methods in Cell Biology, 41. Academic Press, Inc., San Diego.
Rabinovitch, P. S., Torres, R. M., & Engel, D. (1986). Simultaneous cell cycle analysis and two color surface immunofluorescence using 7-amino-actinomycin D and single laser excitation. Journal of Immunology, 136(7), 2769–2776.
Sakaue-Sawano, A., Kurokawa, H., Morimura, T., Hanyu, A., Hama, H., Osawa, H., Kashiwagi, S., Fukami, K., Miyata, T., Miyoshi, H., Imamura, T., Ogawa, M., Masai, H., Miyawaki, A. (2008). Visualizing Spatiotemporal Dynamics of Multicellular Cell-Cycle Progression. Cell, 132(3), 487–498. https://doi.org/10.1016/j.cell.2007.12.033
Vindeløv, L. L., Christensen, I. J., & Nissen, N. I. (1983). A detergent-trypsin method for the preparation of nuclei for flow cytometric DNA analysis. Cytometry, 3(4), 323–327. https://doi.org/10.1002/cyto.990030503
Watson, J. V., Chambers, S. H., & Smith, P. J. (1987). A pragmatic approach to the analysis of DNA histograms with a definable G1 peak. Cytometry, 8(1), 1–8. https://doi.org/10.1002/cyto.990080101
Clonetech. (n.d.). Fluorescent proteins and reporters – Fucci cell cycle vectors. https://www.takarabio.com/products/cell-engineering-and-gene-regulation/cell-cycle-research/fucci-cell-cycle-vectors
DeNovo Software. (n.d.). DNA analysis. In Flowbook. http://flowbook.denovosoftware.com/chapter-6-dna-analysis
Thermo Fisher Scientific. (n.d.). Premo™ Fucci cell cycle sensor (BacMam 2.0). https://www.thermofisher.com/order/catalog/product/P36239